



Litecoin (LTC) has formed a rounded top and has fallen below the neckline of the pattern, indicating a shift toward a bearish market. However, when we consider the broader price action, LTC is sitting at a significant level that produces massive rallies.
Litecoin loses support at $54
Priced $54 Litecoin has lost a major support level, which is the 50-day moving average at $56. Not only did the coin lose this support level, but it also dismantled the bullish uptrend it was forming since April. When a bullish uptrend is lost and the price falls below the 50-day moving average, it generally indicates that short-to-medium-term momentum is weakening and buyers are no longer firmly in control.
As the most common indicator of trend direction, the 50-day MA means that buying and trading above it would show an active bull market trend whereas breaking below this MA indicates structural change within the market.
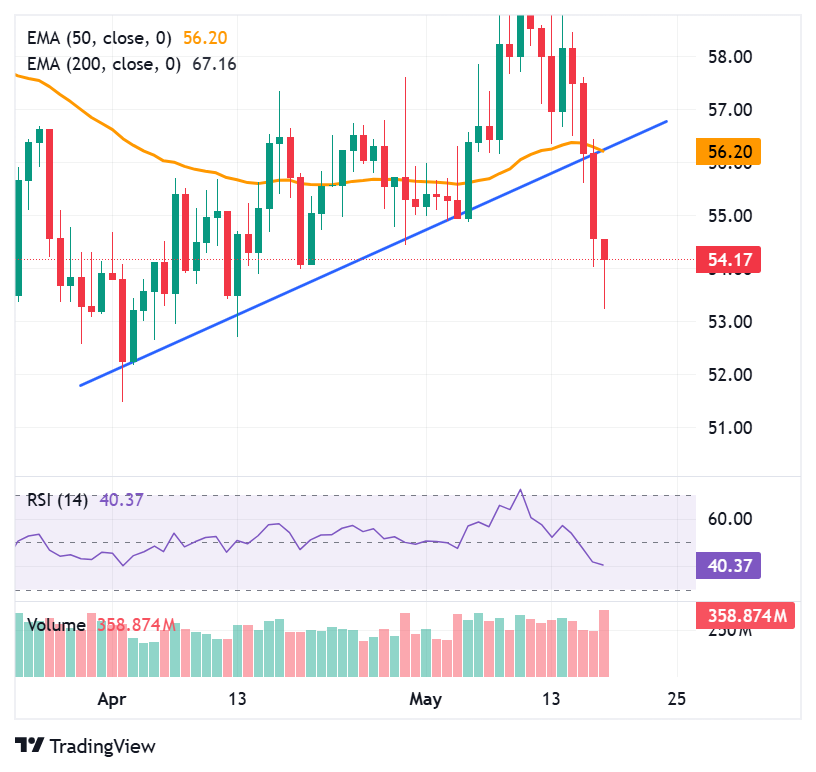
At this point, traders tend to change their actions swiftly. Profit-taking traders will be keen on locking their gains through selling their stocks, whereas momentum traders will choose to wait until things get more concrete.
A few people might also begin building short positions based on anticipation of the downward continuation. On the other hand, the long-term investors may be less responsive to what is happening and concentrate more on a higher-timeframe chart pattern.
In terms of psychology, the market tends to move from the “buy the dip” mode into the “wait and see” mentality. This move results in higher volatility, slower upswings, and a generally corrective period.
However, a break below the 50-day moving average does not always confirm a full trend reversal, as price can sometimes reclaim the level quickly and continue its prior uptrend if buying pressure returns.
Litecoin forms rounded top during May
In analyzing May’s movement for LTC price action, there has been the formation of the pattern known as a rounded top. This is evident by the fact that the prices have gone lower than the neckline. The rounded top is an indicator that shows how market sentiments move from bullish to bearish.
The bulls will have reduced buying power, and the bears will gain dominance through the process of weakening the market. It takes time for the price to change direction, hence creating the curved shape.
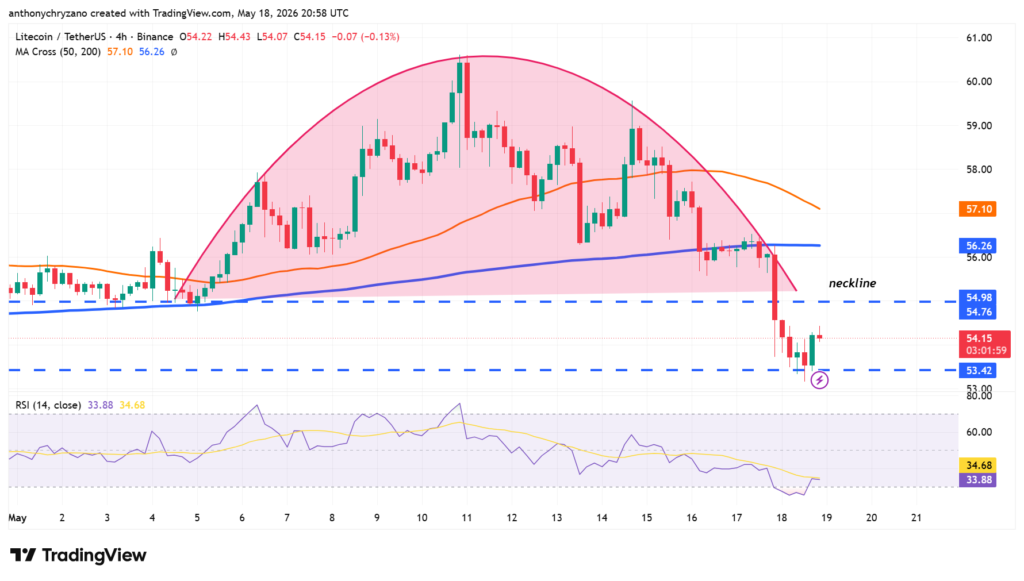
In this process, buyers tend to become less assertive while traders who entered the trade earlier start taking their profits, which results in increased selling pressure. Also, fresh buyers do not feel comfortable entering the market at higher price levels, resulting in momentum dying down gradually. As a result, there is a distribution process where the asset changes hands.
As the pattern develops, each successive price push becomes weaker than the previous one, signaling declining bullish conviction. Eventually, selling pressure outweighs demand, and the market transitions from consolidation to a potential downtrend.
In simple terms, a rounded top reflects a slow exhaustion of buying strength and often signals that the market may be preparing for a reversal lower. Although the 4-hour chart may look bearish, there is a lot of noise in the short time frame, and as such, it could be misleading. As such, it is important to always take a look at the weekly timeframe, as it gives a better understanding of the broader market.
Weekly chart looks bullish despite hourly charts looking gloomy
When looking at the chart below, LTC prices are currently at the 2022 October levels, which acted like a launchpad and took the price to over $100. Litecoin has done the preliminary step of holding the support level at the $54 support level.

However, this alone is not going to be sufficient for the bulls to take a leap. The secondary step is that the bulls need to cross above the resistance level at $65 comprehensively with volume and momentum. Once this hurdle is clear, LTC will have more open space to climb and reach the psychological triple digits.
Meanwhile, the relative strength index indicator, which gauges whether the prices are overvalued or undervalued, is not showing extreme conditions. This shows that the market is currently saturated, and the bulls will need to put their foot on the pedal and push the prices higher.