Hyperliquid (HYPE) open interest has climbed by 130 percent since February, and capital is flowing into the network. Despite capital flowing into the network, HYPE prices have broken downwards from the symmetrical triangle.
Hyperliquid open interest spikes by 130% since February
According to technical educator and market analyst who goes by the pseudonym Cryptobusy, the Hyperliquid open interest spiked by 130% from February levels. A sharp increase in open interest indicates that more futures and perpetual contracts are being opened, meaning fresh capital is flowing into the market rather than traders simply closing existing positions.
Rising open interest is generally viewed as a sign of growing participation, as it reflects an increase in the total number of active positions. Higher open interest also tends to improve market liquidity, allowing larger trades to be executed more efficiently.
However, open interest alone does not reveal whether traders are predominantly bullish or bearish because every futures contract consists of both a long position and a short position. As a result, a rise in open interest only confirms that more positions are being created, not the direction of market sentiment.
Hyperliquid futures market is skewed towards bullish bets
This is where the funding rate becomes an important indicator. A positive funding rate means traders holding long positions are paying those holding short positions, which typically occurs when demand for long positions exceeds demand for shorts. In other words, the market is skewed toward bullish bets, with more participants expecting prices to rise.
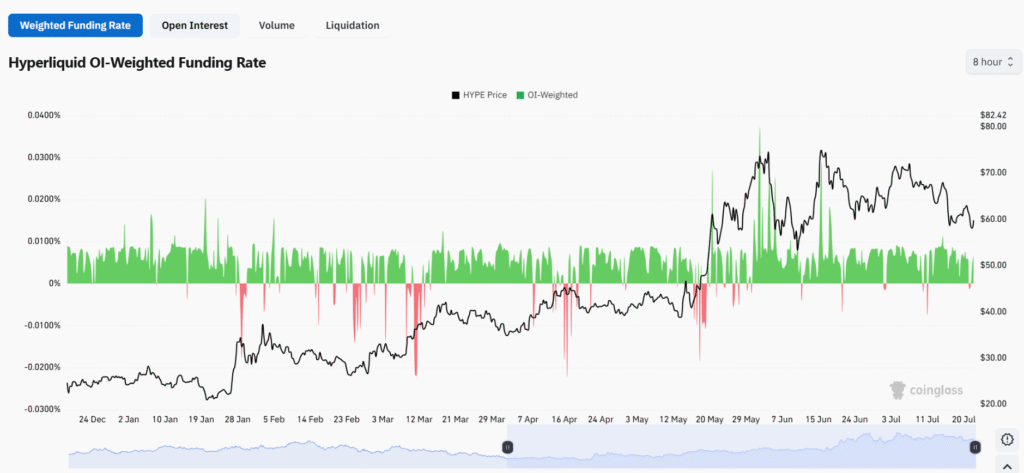
When rising open interest is accompanied by a positive funding rate, it suggests that the fresh capital entering the market is primarily supporting long positions rather than bearish ones. Together, these metrics indicate increasing trader participation alongside growing bullish conviction, reinforcing the strength of the ongoing market trend.
HYPE crashes and looks for support at $54
Although the futures market is skewed towards the bullish bet, HYPE does not reflect this momentum on the chart shown below. HYPE has broken downwards after completing the symmetrical triangle pattern.
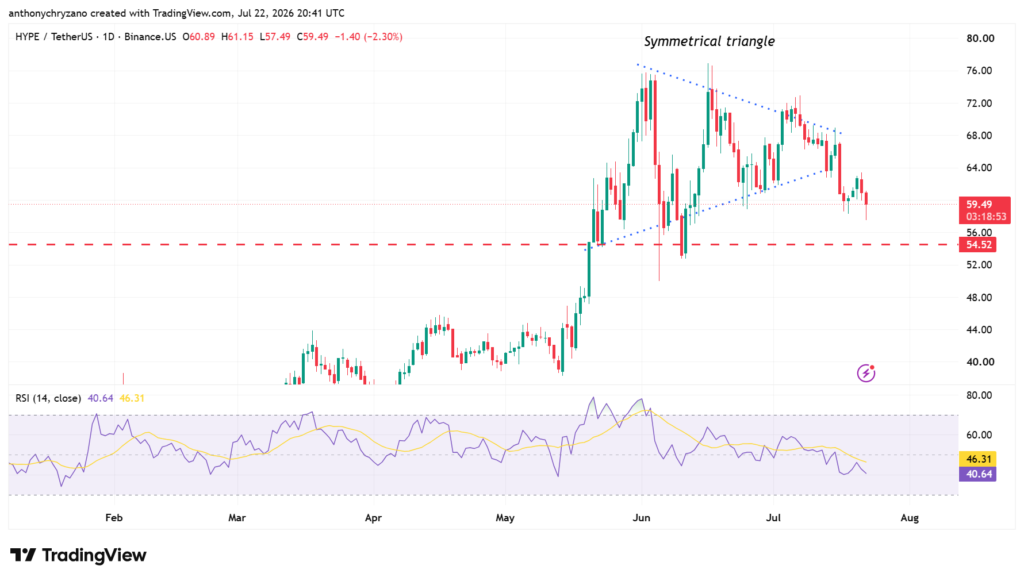
A symmetrical triangle is a chart pattern formed when the price creates a series of lower highs and higher lows, causing the trading range to narrow over time. This shows that buyers and sellers are reaching a temporary balance, with neither side able to establish clear control. As the price approaches the apex of the triangle, volatility typically declines while pressure builds for a decisive move.
The eventual breakout determines the next likely direction. A downward breakout occurs when the price falls below the triangle’s lower trendline with increased selling pressure. This indicates that sellers have gained control of the market, ending the period of consolidation.
In addition to this, the technical indicator, the relative strength index, has crashed below the simple moving average while making lower highs. This shows that the bears are currently dominating the market. As HYPE is still searching for a floor price, it may end up landing on $54.