Ethereum is selling at a cheap price, but the cycle bottom has yet to come. In the meantime, ETH has broken above the mutlimonth trendline and the 50-day moving average, two major resistance levels.
ETH is undervalued but cycle bottom yet to come
According to CryptoQuant, ETH is currently undervalued, and it is quite cheap. However, the cycle bottom for ETH has not yet come, as historic data still does not align with the market bottom. CryptoQuant highlighted some events that happen when ETH reaches the market cycle bottom.
ETH investors still underwater
ETH is currently trading below its realized price, which represents the average cost basis of all ETH holders based on the last price at which coins moved on-chain. With ETH trading near $1,900 compared with a realized price of $2,304, the asset is around 17% below the average holder’s cost basis, meaning many investors are holding unrealized losses.
Historically, periods when ETH trades in the lower half of its realized price band have often coincided with market bottom formations, as selling pressure tends to weaken and long-term accumulation increases. This creates an asymmetric risk-reward setup, where the potential upside from a recovery could outweigh the remaining downside risk.
ETH has shifted from being highly overvalued relative to Bitcoin to a more neutral valuation, with the ETH/BTC MVRV ratio falling from 0.95 in August 2025 to around 0.65. This decline shows ETH has lost some of its relative premium compared with BTC, but it has not yet reached extreme undervaluation levels. Historically, ETH bottoms against Bitcoin have formed near the 0.45 MVRV threshold, suggesting further downside may still be possible before a major reversal.
The ETH/BTC exchange inflow ratio measures the amount of Ethereum flowing into exchanges compared with Bitcoin, indicating relative selling pressure between the two assets. A ratio above 1.0 suggests more ETH is entering exchanges than BTC, which can signal higher potential selling pressure on Ethereum.
The ratio has fallen from above 1.5 in August 2025 to around 0.8, showing that ETH selling pressure has eased compared with Bitcoin. However, it remains above the historical ~0.4 level seen during previous market bottoms, suggesting ETH may not have reached a complete accumulation zone yet.
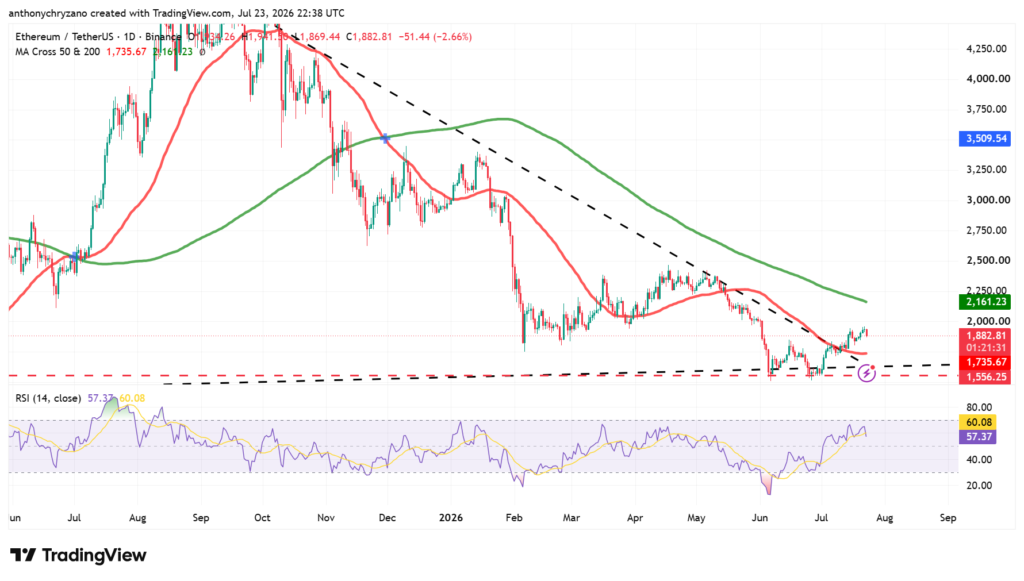
Meanwhile, on the daily chart, ETH has broken above the multimonth trendline, which was resisting movements above it. Not only has ETH broken above the trendline, but it has also broken above the 50-day moving average, which is a good sign. But looking at the relative strength index indicator, the price is heading towards the overvalued region, and there is a high chance that ETH could fall, as correctly stated by CryptoQuant.