The ETH/BTC pair has flipped the bearish macro structure that has been existing for months. With the ETH/BTC pair breaking from this macro pattern, an analyst predicts that the pair could reach $0.050 if it manages to hold above the $0.027 support level and the bullish structure.
ETH/BTC pair breaks a 1-year-long downtrend but reversal confirmation hangs in the balance
Crypto analyst who goes by the pseudonym Crypto Patel stated that the ETH/BTC pair, which was on a downtrend for multimonths, has flipped. For the past nearly year, the pair has been making lower highs and lower lows inside a descending channel. However, as the market starts to recover, the bearish outlook seems to be waning.
As there is still doubt surrounding this potential reversal, Patel stated that the ETH/BTC pair should hold above the $0.027 support level so that the bullish thesis could be validated. In the event that ETH manages to hold above the above-mentioned support level, it could rise to $0.07 as well. So the question is, will the ETH/BTC pair hold above this level so that the reversal could be confirmed?
Well, according to another platform that is into crypto price prediction, ETH might hold above this level. The platform named Norris Digital Assets observed ETH to be taking the same route as Silver did back in the 1970s.
ETH might hold above $0.027 if it imitates Silver’s trading path
ETH seems to be trading inside a 9-wave triangle, which silver traded in in 1970. A 9-wave triangle is a technical analysis pattern that refers to a more complex triangular price structure with around nine noticeable swings or waves. Unlike a standard Elliott Wave triangle, which consists of five main waves labeled A, B, C, D, and E, a 9-wave triangle includes additional smaller subdivisions within those waves.
Traders use this structure to identify periods of consolidation, where the price repeatedly moves up and down while gradually forming a triangle. The pattern can eventually lead to a breakout once the consolidation ends, although the direction of the breakout depends on the broader market trend and other technical indicators. If what the platform says plays out, ETH could spike up and hold above the level mentioned above.
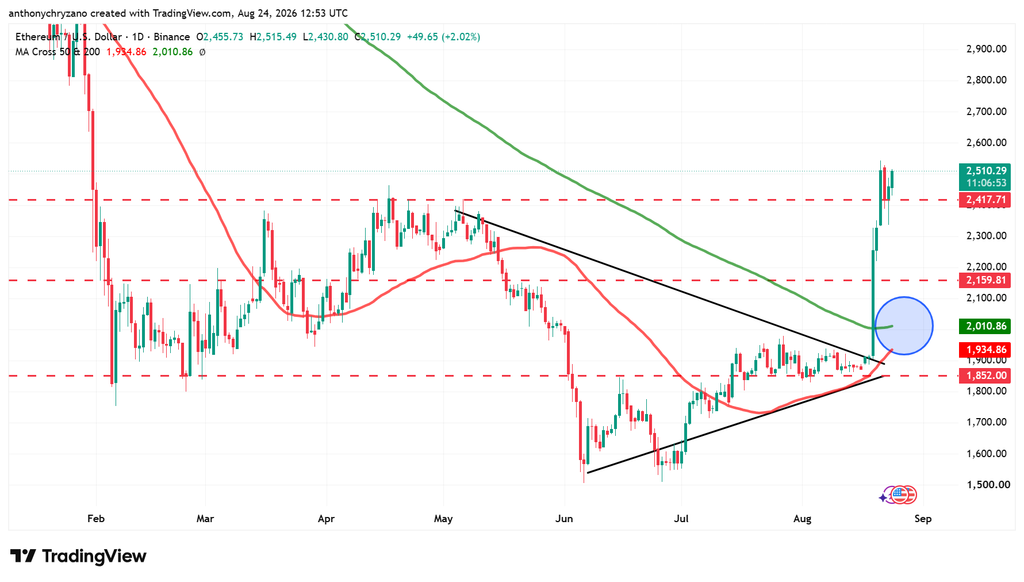
From a technical point of view, the 50-day MA is approaching the 200-day MA, and if these two intersect, there could be a golden cross. It is generally viewed as a bullish signal because it suggests that recent price momentum is becoming stronger than the longer-term trend. Traders may interpret it as a sign that the asset could be entering a sustained uptrend, potentially attracting more buying interest. However, a golden cross is a lagging indicator, meaning it confirms a trend after some of the price movement has already occurred, so it does not guarantee that the price will continue rising.