



Bitcoin is trading under $80,000, having lost 3.52 percent in the last seven days. BTC is at at $77,454 at the time of going to press. The deteriorating technical picture, the institutional sell-off, and the macros pushing in from every side are more substantial than just the price action may suggest. It is not just a pullback, and the market now looks to be firmly weighted toward the downside from a risk/reward standpoint.
ETF flows are sending a signal the price hasn’t fully priced in
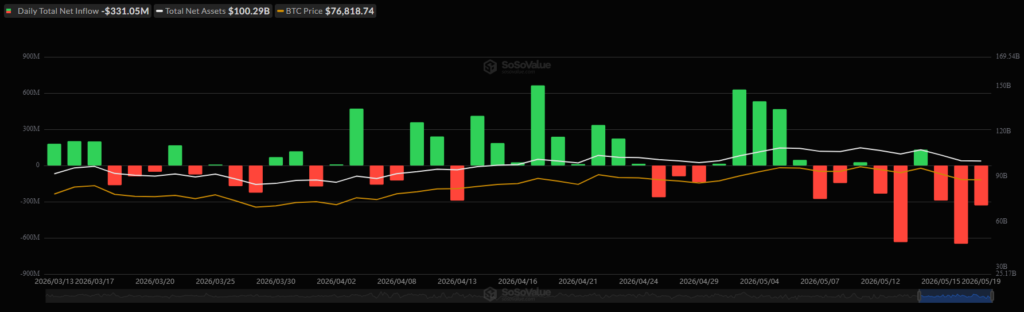
Bitcoin continues to stay in the net redemption trend that began on May 12. What is particularly significant here is the timing: the selling actually took place while the Nasdaq 100 and the S&P 500 were printing new all-time highs. Institutions did not reduce their holdings because equity markets were frightening them, and they reduced holdings in spite of equity markets surging higher. That divergence is worth noting.
The ETF’s value for Bitcoin still maintains its strong value with ~$56.7B, and that can’t be termed a capitulation trend. But then a similar pattern to this occurred leading into the winter 2025/2026 correction, where BlackRock iShares products also played. Taking profit at cycle highs by large and smart holders reflects more of a smart market positioning.
The technicals are aligned on the bearish side
Considering the moving average trend, the largest cryptocurrency is trending below them. SMA7 has the value of $78,379, while SMA30 is currently sitting at $78,654. For the long-term SMAs, SMA200 is at $81,268, and EMA200 holds the value of $81,932. The current price of Bitcoin is underneath them at the price of $77,454.
The MACD histogram is at a deep negative of -705.90, and the MACD line of 408.06 is below the signal line at 1113.95. RSI7 has dropped to 31.84 (starting to look oversold in the short term). window), RSI14 at 44.30, and RSI21 at 48.89 are neutral. Short-term oscillators are strained, so a bounce may occur, but the overall look of the medium-term trend structure is breaking down.
The Fibonacci picture helps too. The swing from $73775 to $82792 has the 61.8 percent retracement at $77219, which is where the price was. In the case of the asset falling below this, the next port of call is the 78.6 percent retracement at $75705. Beneath that it’s the previous swing low at $73775, where it’s likely the next significant support level will be established before 60000 enters the mix.
Macro is not supportive, and it’s not transitory
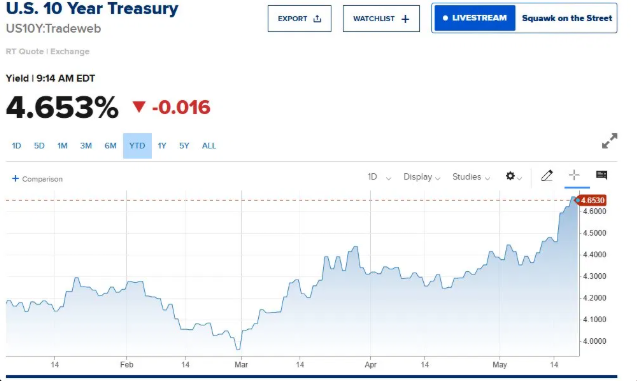
The 10-yr U.S. Treasury yield is 4.653 percent, and we see a distinct uptrend on the YTD chart, from the 4.0s range in early March. Growing yields reduce the valuation argument for speculative assets by increasing the opportunity cost for them. The value proposition of Bitcoin has been a macro hedge this entire cycle, and instead we see it act as a high-beta risk asset, selling off while equity markets hold.
The dollar adds to the complexity. Dollar strength tends to be a bearish factor for cryptocurrencies and commodities. The sustained inflation story, and particularly the prospect for higher oil (given Strait of Hormuz risk), should continue to keep Fed cut expectations in check, maintaining a high-yield environment. That is simply not the type of macro backdrop in which BTC excels.
How the current cycle compares to 2021–2022
The comparison with the 2021-2022 cycle structurally does make sense, though the perspective matters. Bitcoin dropped ~80 percent from the highs in that cycle. At even $60K, which people are starting to mention, the current drawdown from the high is closer to ~50 percent. That is a flatter correction in relation to historical cycles, and BTC’s increasing market cap ($1.55T) likely does moderate the peak as in the previous cycles.
Perhaps a more appropriate parallel than how far 2022 declined would be how similarly this correction unfolded (a good initial rally, rejection at a Fibonacci and EMA confluence, institutional position-squaring, then drop through the short-term momentum indicators). The 2021-2022 cycle did not unwind this quickly on a similar setup.
The $80,000 level is now overhead resistance
The largest cryptocurrency has failed to give a sustained trend above the $80K levels in the most recent attempt. The asset must reclaim the levels of the 23.6 percent Fibonacci retracement, which stands at $80,664, and hold above the EMA50. In addition to this, it must also flip the MACD histogram. Currently, the mentioned conditions are not matching for the bullish trend.
Considering the Fibonacci levels of 61.8 percent at $77,219, if the price fails to hold that, the next support lies close to $75,705 and then $73,775. In the case of a breakdown below the prior swing low, it can open the door towards the next important support level of $60,000.