



Stellar (XLM) has been trending from early February through late May, grinding inside a band most traders didn’t even notice and assuming this to be boring price action. The support at $0.1494 absorbed every breakdown attempt. The resistance level at $0.1847 rejected every recovery that the asset has tried for. Five distinct touches on the floor. At least three failed pushes at the top.
Volume for most of this month was running somewhere between $70 million and $160 million per day. This was not a normal lacking situation. Something absorbed a lot of supply on the way up, and the price still closed near the high of the day.
What’s the actual price action stating
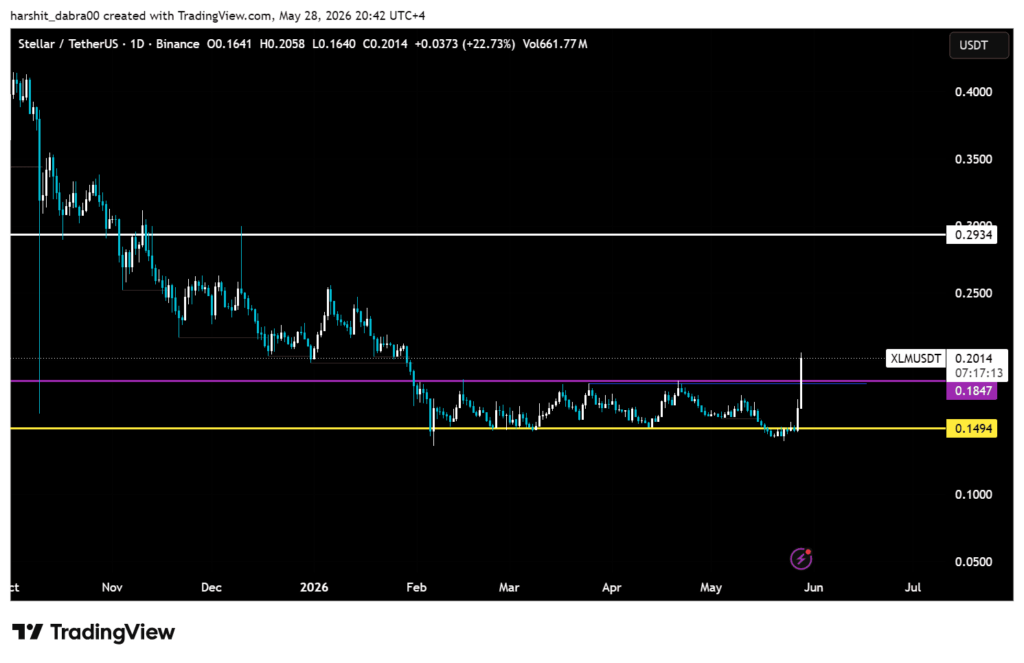
The time frame from the mid may has seen this digital asset slipping below the $0.1494 support, touching lows around $0.1474 and then quickly rallying back to the previous support. This little undercut to the $0.1474 level is what warrants continued staring. A failed break below a well-defined support zone and quick recovery could suggest either a failing support zone. This has turned out to be less robust compared to what it appeared or a deliberate long liquidation that sets up a genuine bullish move. After the following price action, the second scenario is more probable.
The jump from $0.1474 to the high so far in writing this at $0.2058 is a move of 39.3 percent over some two weeks. The close today at $0.2014 sees the price at and above the 161.8 percent fib extension of the preceding move. Measured from a swing low of about $0.14002 to a swing high at $0.17344 puts this extension is at $0.19410. Price managed to cross it on the very same candle it broke out of the range. Considering it on the analytical side of it, then it doesn’t seem like a sign of a weak breakout.
Between current price and $0.2934 there is essentially nothing
This is where the greater attention should be drawn than to what it gets. There is a prominent line drawn horizontally across this chart at $0.2934 which is basically the next major horizontal resistance from past price action. The zone from $0.2014 to $0.2934 is relatively open; there are no notable consolidations, no volume shelf, and also no major swing high. The price of XLM may well rip through this space in no time if it is supported by the momentum. It is either a fantastic opportunity or a setup if the breakout is genuine.
If we look at the side of moving averages, then the 200 day SMA is at $0.19119. XLM momentum is pointing out that it may close this daily candle above that for the first time in this cycle. This is more important to some traders than others, but it does carry that much significance. The EMA 200 is at $0.19658, was also broken. If the $0.19 to $0.20 level re-tests as new support, this will be a compelling structure, not just like a normal breakout-type structure.
The momentum indicators perspective
The RSI is also showing up with some important signals. The RSI7 at 71.78 is now in the overbought territory for XLM. The RSI14 at 59.14 is not that high. The oscillator for the shorter time frame is leading that for the intermediate term, which tends to support a “breakout phase” signal instead of calling it as a top.
The other momentum indicator, MACD histogram is not that quite convincing and is currently stands with a figure of 0.0010311 flipped positive; the crossover is current. Again, nothing to bet the on this but it still doesn’t means any bearish signal at the moment.
On the fundamental side of Stellar Soroban, it has been live since early 2024 which is a smart contract platform and provides 3 to 6 seconds of finality and 0.00001 XLM per transaction. The compliance infrastructure to authorize, freeze, and claw back positions is Stellar for regulated asset issuance in a way most smart contract platforms still cannot face. None of that built the current price action. But it is probably why XLM continues to carries a $6.68 billion market cap after a year that ended up being negative 29.54 percent.