TAO is changing hands at $210.73. This mentioned level stands close to the daily pivot level of $209.78. This digital asset has dropped over 70 percent since it last traded over $450 in October, and the past five weeks have seen it doing something odd for an asset that deep into a drawdown.
This digital asset, since the middle of June, has traded in a very small range between approximately $194 and $225. Not a bounce and not a breakdown. This is a market that was battling at $242.7 resistance in early June, was unable to break, and plunged to $194.1. This is the zone where it just stagnated. Most of the indicators out there today are screaming neutral.
TAO chart is not depicting a clear direction
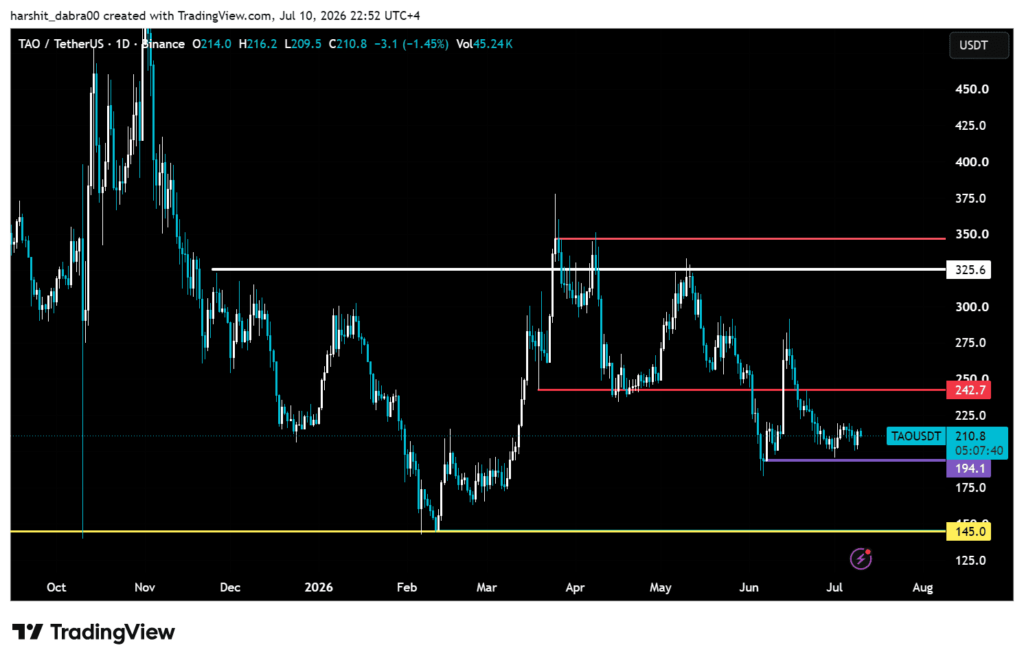
Since November, TAO, a Layer 1 (L1) blockchain, has been in a downtrend and has followed a series of lower highs. The price of this digital asset peaked around $450 in November and then witnessed a correction. Following that, it dropped to low $150s by February and rebounded to $375 in April, and since then, the price has moved on the lower side. Every recovery attempt was capped by the level of $325.60 between December and May. In the month of June, $242.7 was working as resistance and was responsible for pushing the price back into this current range.
What stands out now is how much tighter the market has become. Earlier this year, TAO regularly moved 20 percent to 30 percent within a few sessions, but the current range has stayed around 15 percent for more than a month. Selling pressure has eased, yet buyers have not been strong enough to reclaim $225 or challenge $242.7 again. Volume remains average, leaving the market balanced with neither side in control.
The momentum is more on the flat side and has not flipped yet
The MACD line sits at negative 6.23 against a signal line of negative 7.34, giving a histogram reading of positive 1.11. That is a bearish setup that is losing steam rather than a bullish one taking shape. The gap between the lines is narrowing, which usually shows up before a period of chop, not before a strong breakout in either direction.
Considering the other momentum indicators like RSI, it is confirming the same picture from a different angle. The 7 period reads 51.17, the 14 period reads 46.06, and the 21 period reads 45.09. All three sit within a few points of the midline. There is no divergence, no overbought pressure, and no oversold spring loaded for a bounce. This is what a market looks like when buyers and sellers have exhausted their conviction.
Short-term and mid-term moving averages remain below the longer-term average, so the broader trend is still classified as corrective. A flat momentum reading inside a downtrend does not mean the downtrend is over. It means the next clear move, whichever direction it comes from, has not started yet.
The next scenario is decided by these levels
Fibonacci levels indicate TAO is still deeply within a correction and hasn’t entered a sustained recovery but rather trades under a 78.6 percent retracement. The nearest Fibonacci resistance levels sit at $215, $231, and $242.7. A sustained move above $242.7 will see buy momentum picking up significantly.
Selling momentum may increase if the asset goes for a breakdown below $194.1, followed by the level of $145. As it stands, prices hover around daily pivot $209.78 indicating the market is balanced, but there is still a need for a clear direction, and multiple catalysts could decide the next move.