Chainlink’s four-year-long downtrend could be coming to an end as the coin has crossed above the 200-day MA on the higher timeframe, and the coin is also showing a bullish divergence.
Crypto analyst Micheal van de Poppe spotted Chainlink (LINK) crossing above the 200-day on the higher timeframes after a 4-year-long downtrend. Crossing above the 200-day moving average is quite an event because the indicator is widely used to determine an asset’s long-term trend. LINK had remained under this level for an extended period as its broader downtrend persisted.
Moving above the 200-day MA, particularly alongside a break above the previous downtrend, suggests that selling pressure may be weakening and that the four-year bearish structure could be approaching an end. However, LINK would need to sustain its position above the indicator and establish higher highs and higher lows to confirm a lasting trend reversal.
Chainlink weekly chart shows bullish divergence
Further substantiating the bullish momentum, there is a bullish divergence that has happened on the Chainlink weekly chart. For instance, when the RSI indicator is compared with the price action, there is a divergence. Usually, the RSI indicator moves with the price, making lower lows or higher highs together.
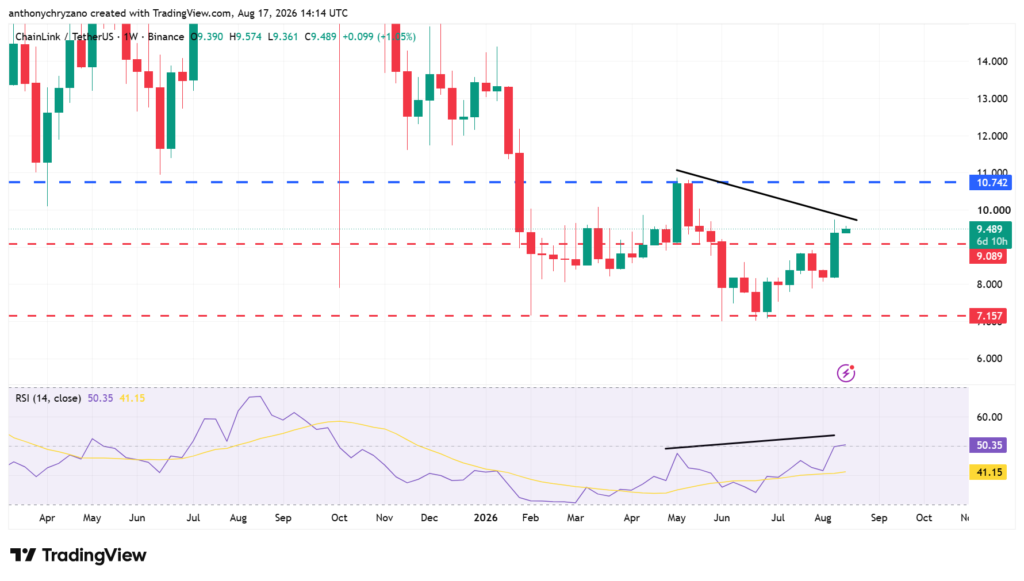
However, LINK is showing a bullish divergence, with the price forming a lower high while the RSI records a higher high. This suggests that although the price structure remains bearish, underlying momentum is strengthening. The divergence could indicate that selling pressure is weakening and support the possibility that LINK’s long-term downtrend is losing momentum. As such, LINK could be targeting the $10 as the next level.